Truck Fill Rate KPI: Formulas, LDM Utilisation, Cost per Pallet
How to measure truck fill rate: loading metre, pallet, weight and volume utilisation plus cost per pallet, with formulas, a worked example and reporting tips.
Operations & software · · 5 min read
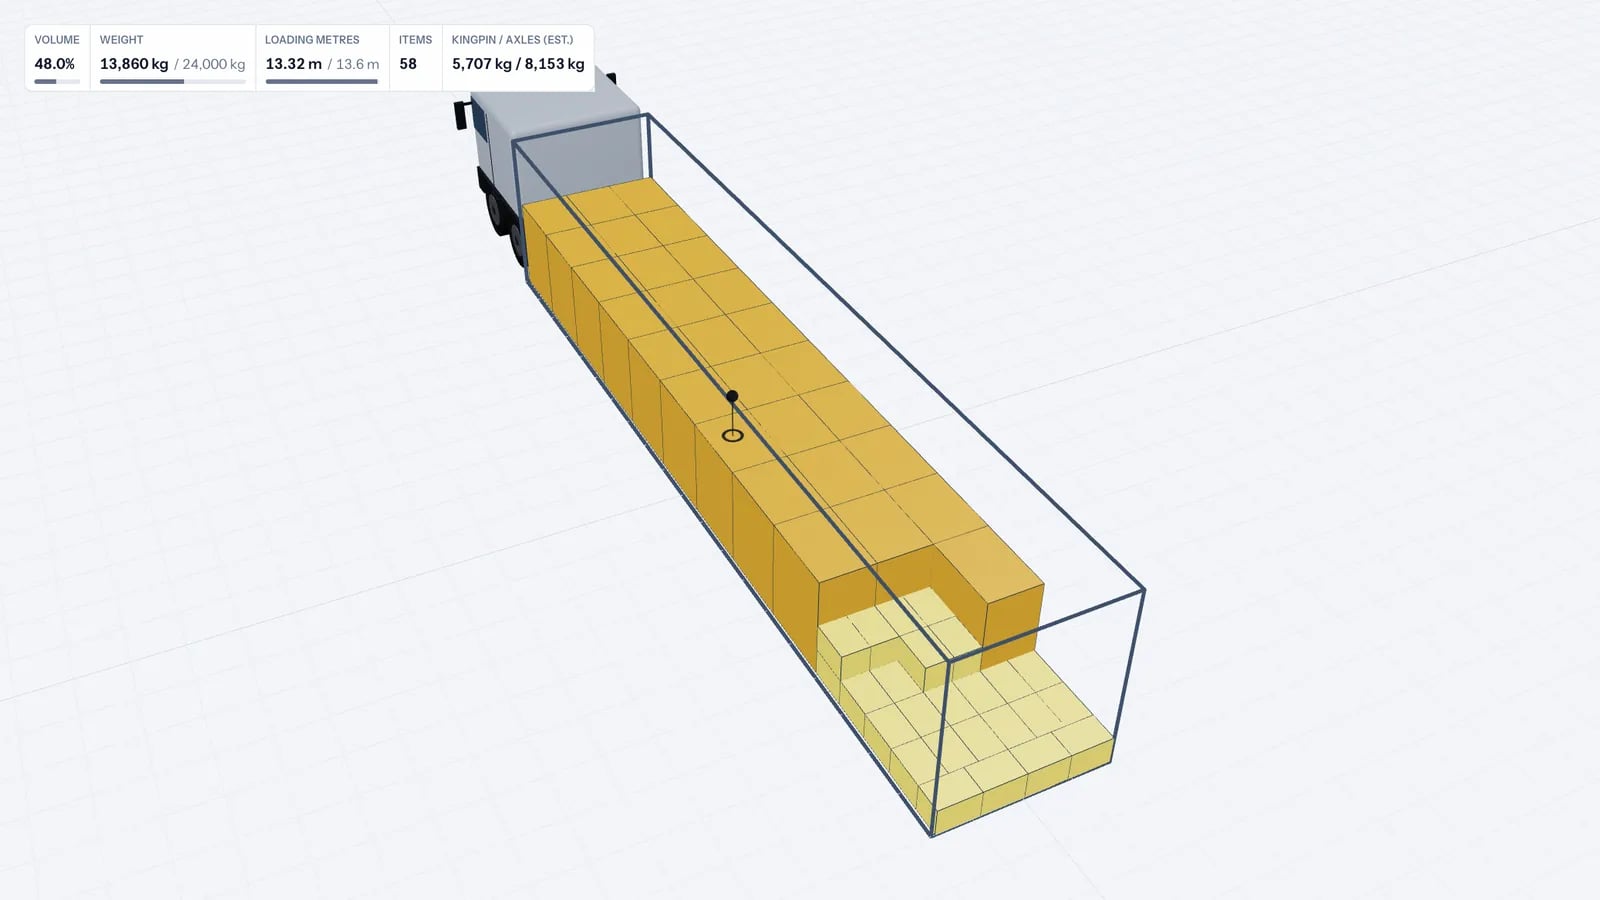
Truck fill rate is the share of a vehicle’s capacity a load actually uses. Because a truck can be "full" by floor space, by weight or by volume, a useful KPI reports more than one measure: loading-metre (floor) utilisation, weight utilisation and volume utilisation, plus cost per pallet or per tonne to show what the fill means in money.
The four fill measures
Measure: Loading-metre utilisation
- Formula
- used LDM ÷ vehicle length (e.g. 13.6 m)
- Best for
- Palletised road freight, groupage
Measure: Pallet-position utilisation
- Formula
- pallets loaded ÷ pallet positions (e.g. 33 Euro)
- Best for
- Uniform pallet flows
Measure: Weight utilisation
- Formula
- cargo weight ÷ payload
- Best for
- Dense goods: drinks, steel, paper
Measure: Volume utilisation
- Formula
- cargo volume ÷ internal volume
- Best for
- Cartons, containers, air freight
| Measure | Formula | Best for |
|---|---|---|
| Loading-metre utilisation | used LDM ÷ vehicle length (e.g. 13.6 m) | Palletised road freight, groupage |
| Pallet-position utilisation | pallets loaded ÷ pallet positions (e.g. 33 Euro) | Uniform pallet flows |
| Weight utilisation | cargo weight ÷ payload | Dense goods: drinks, steel, paper |
| Volume utilisation | cargo volume ÷ internal volume | Cartons, containers, air freight |
Loading metres for pallets loaded side by side across a 2.4 m width are length × width ÷ 2.4, so a Euro pallet (1.2 × 0.8 m) counts as 0.4 LDM and an industrial pallet (1.2 × 1.0 m) as 0.5 LDM. Stacked pallets do not add floor length; that is why LDM utilisation and volume utilisation often disagree. Details in loading metres explained.
Good to know
The binding constraint is the measure closest to 100 %. A trailer at 98 % weight utilisation is full, even if volume utilisation is 45 %.
A worked example
Say a load is 26 Euro pallets, each 120 × 80 × 150 cm and 550 kg, in a standard semitrailer of about 13.6 × 2.45 × 2.7 m inside with a 24,000 kg payload.
- LDM: 26 × 0.4 = 10.4 LDM. Utilisation 10.4 ÷ 13.6 = 76.5 %.
- Pallet positions: 26 ÷ 33 = 78.8 %. (The two differ because 33 Euro pallets use 11 rows of 1.2 m, 13.2 m, so 0.4 m of the trailer is never usable by Euro pallets loaded this way.)
- Weight: 26 × 550 = 14,300 kg. Utilisation 14,300 ÷ 24,000 = 59.6 %.
- Volume: 26 × 1.2 × 0.8 × 1.5 = 37.44 m³. Internal volume 13.6 × 2.45 × 2.7 = 89.96 m³. Utilisation 37.44 ÷ 89.96 = 41.6 %.
Floor space is the binding measure at 76.5 %, so there is room for about 7 more Euro pallets on the floor. Volume looks low at 41.6 %, but with 150 cm pallets in a 270 cm trailer there is only 120 cm above each pallet; it could only be used by double-stacking lower pallets.
Cost per pallet and cost per tonne
Fill rate becomes a business number when you divide the trip cost by what was carried. Say the trip above costs €900 (hypothetical; use your own rate). Cost per pallet is 900 ÷ 26 = €34.62. Had the truck carried 33 pallets for the same price, the cost per pallet would be 900 ÷ 33 = €27.27, about €7.35 less per pallet. Cost per tonne works the same way: 900 ÷ 14.3 = €62.94 per tonne.
Report cost per unit you actually sell or ship: pallets for a palletised flow, tonnes for dense goods, cubic metres or loading metres for groupage. For part loads, see FTL vs LTL on how LDM drives the price.
How to measure consistently
- 1Define capacity per vehicle type once: inside length, pallet positions, payload and internal volume. Use the same figures in every report.
- 2Capture planned values from the load plan and, where possible, actual values from the dock (pallets actually loaded, weighbridge weight).
- 3Record per trip: vehicle type, LDM, pallets, weight, volume, cost, number of stops.
- 4Calculate each measure per trip, then report averages weighted by capacity, not simple averages of percentages.
- 5Show the binding measure: for each trip, whichever of LDM, weight or volume is highest.
Weighted averages matter. If one trip runs at 50 % and another at 100 %, the simple average is 75 %, but if the first used a 7.5 t rigid and the second a 40 t artic, the fleet as a whole was much fuller than 75 %. Sum the used capacity and divide by the sum of available capacity.
Tip
Report planned vs actual fill side by side. A big gap usually means the plan is not followed at the dock or the master data (pallet heights, weights) is wrong.
A simple monthly report can fit on one page: a table by lane or customer with trips, average LDM utilisation, average weight utilisation, cost per pallet (or per tonne) and the share of trips where weight rather than floor space was the binding measure. Add one line on the trend against the previous months. Fewer, consistent measures read every month are more useful than a large dashboard nobody acts on.
Fill rate on multi-vehicle orders
When one order needs more than one truck, look at the fill of the last vehicle. Say an order of 40 Euro pallets goes in two trailers: 33 + 7 means the second truck runs at 7 ÷ 33 = 21 % of its pallet positions, while 20 + 20 runs both at 61 %. The total cost is the same if both are full trucks, but the split matters for axle loads, unloading and for whether the second truck could take another customer’s goods. Planning tools that fill vehicles one after another make the leftover visible, so you can decide whether to book a smaller vehicle for it instead.
Reading the numbers
- Low fill on multi-drop routes is often unavoidable: the truck empties as it goes. Measure fill at departure and judge multi-drop trips separately.
- Low volume with high weight is normal for dense goods; do not chase volume there.
- Low LDM with low weight points to planning: orders that could be combined, the wrong vehicle size, or pallets that could be double-stacked.
- Fill above 100 % in your data means capacity is defined wrongly, or the vehicle was overloaded. Check both.
Avoid comparing your figures with industry "averages" you cannot verify; compare against your own history, by lane, customer and vehicle type. Improvements are covered in reducing empty space in trucks, and the emissions side in how better loading reduces freight emissions.
A load planner gives you the planned values with no extra work. EveryLoading’s stats bar shows volume used, weight against payload and loading metres for each plan, which you can copy into your trip record.
Frequently asked questions
What is a good truck fill rate?
It depends on the goods and the route: dense goods hit the weight limit early and multi-drop trucks empty as they go. Track your own history by lane and vehicle type and look at the binding measure rather than a single percentage.
Should I measure fill rate by volume or by weight?
Measure both, plus loading metres for pallet freight. Whichever is closest to 100 % is the one limiting that trip.
How do I calculate LDM utilisation?
Add up the loading metres of the pallets on the floor (length × width ÷ 2.4 each, stacked pallets not counted twice) and divide by the usable length of the vehicle, for example 13.6 m.
Why use cost per pallet rather than cost per trip?
Cost per trip hides how much was carried. Cost per pallet or per tonne shows directly what a fuller truck saves.
Keep reading
Operations & software · · 5 min read
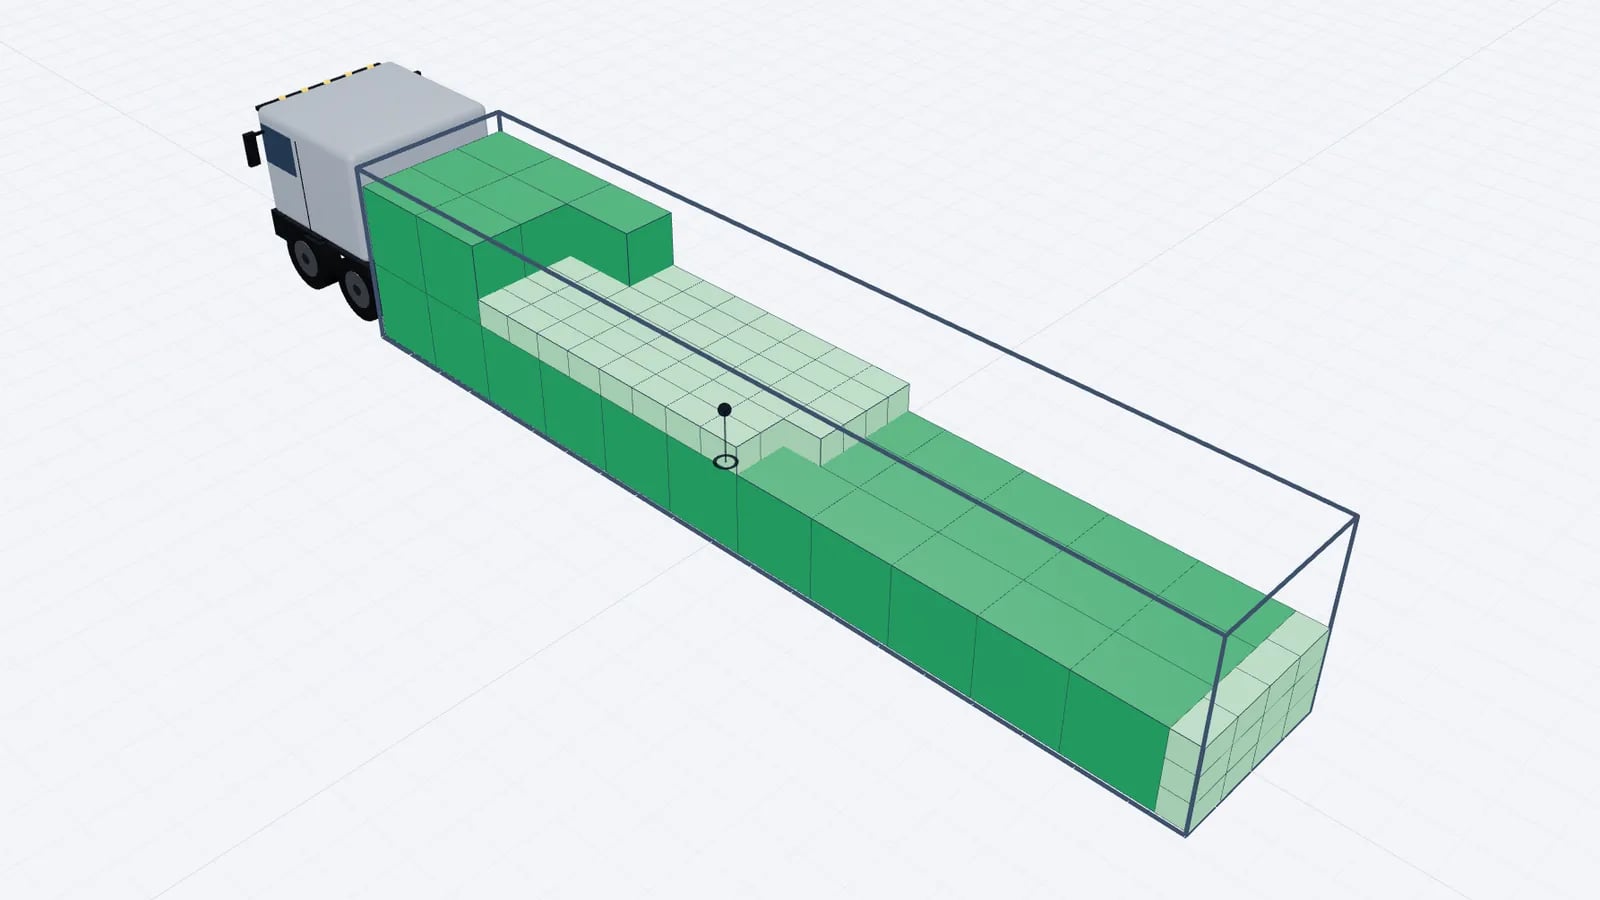
Reduce Freight Emissions With Better Loading: How to Estimate
Better load planning cuts freight emissions by avoiding truck trips. A step-by-step method to estimate the CO2e saving from higher fill rates and report it.
Read article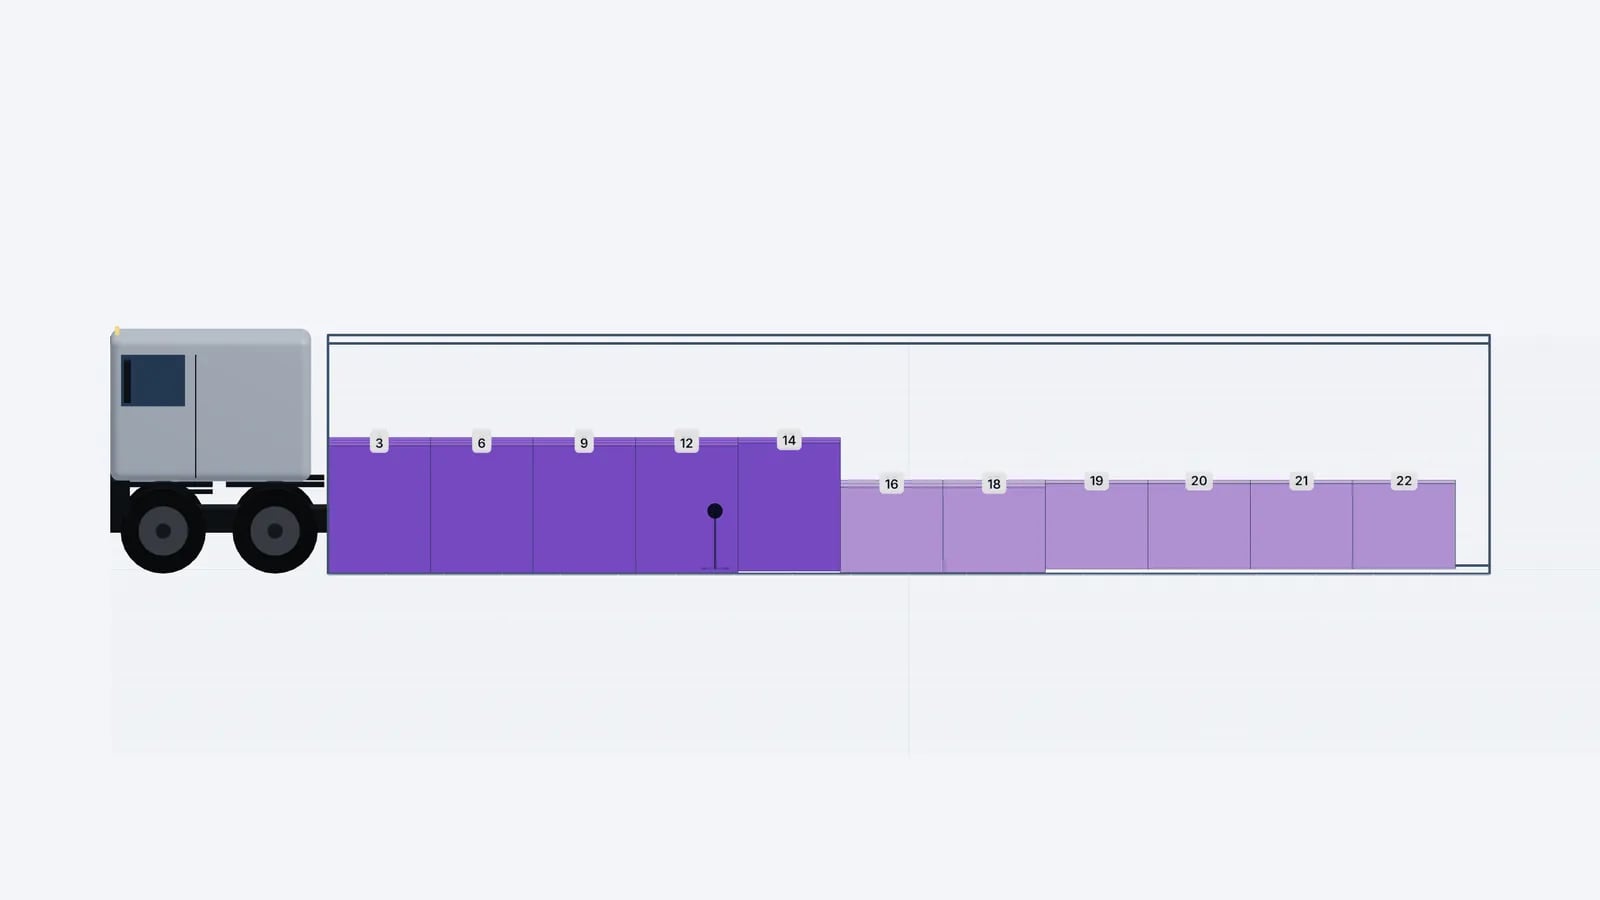
Operations & software · · 5 min read
Loading Plan for Drivers: What the Paper and the Link Need
What drivers and the warehouse need in a loading plan: manifest, loading sequence, top/side/rear drawings, stop order and weights, on paper or a phone link.
Read article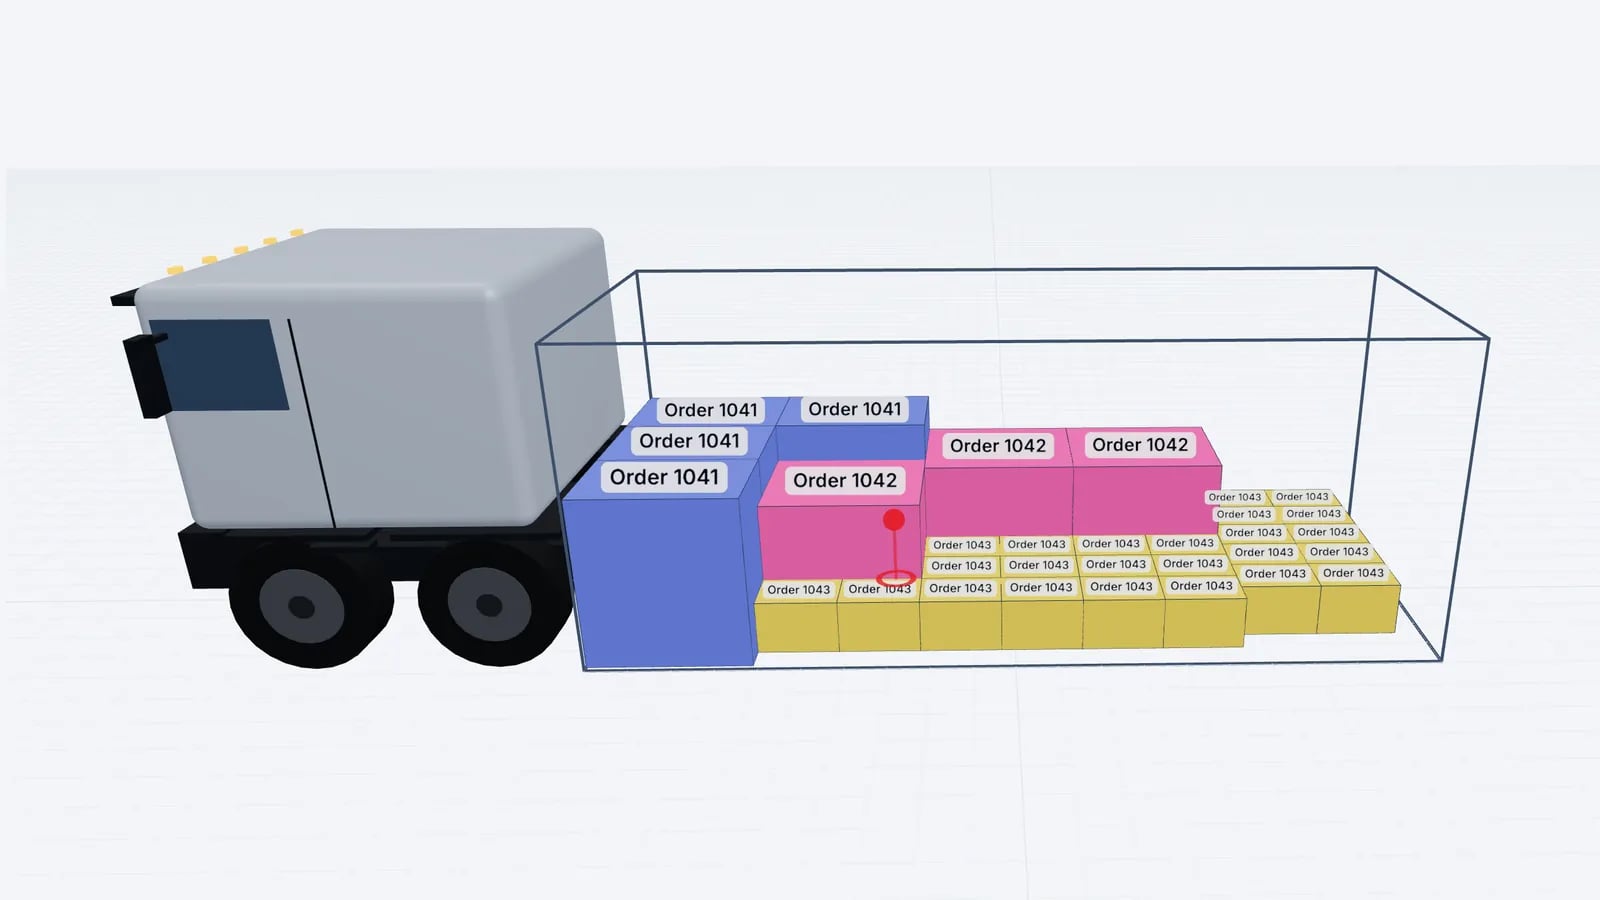
Operations & software · · 5 min read
Load Planning in Excel vs a 3D Planner: When to Switch
Where load planning in Excel works, where it breaks (stacking, mixed sizes, axles, sequence) and how to keep your spreadsheet as input for a 3D planner.
Read article